STATISTICS
Tables & Graphs — Pictograms
⏳ 30–45 mins independent study
✨ FREE Recap test page included
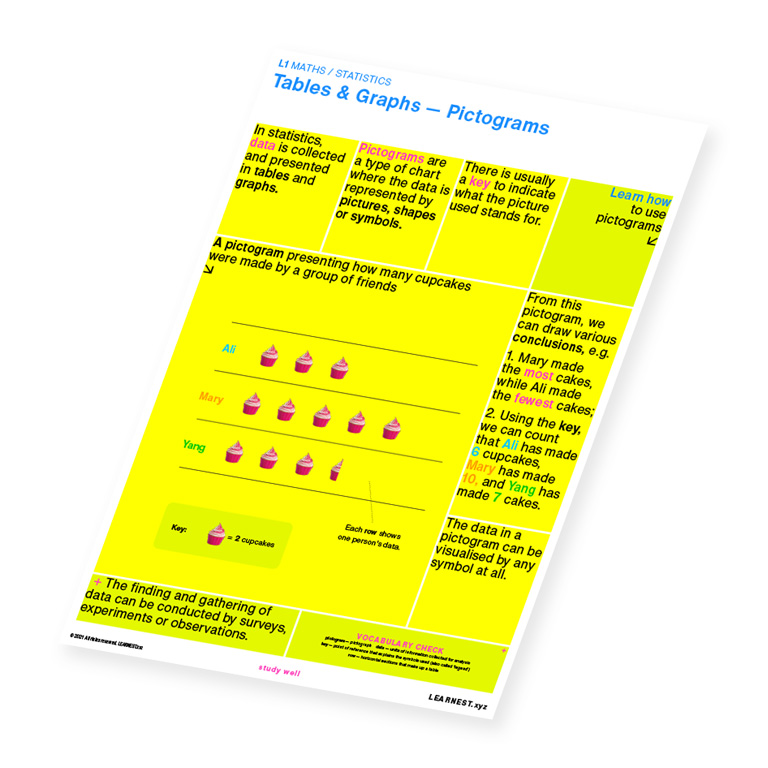
“understand simple pictograms;”
“count and sort categories by quantity;”
“total and compare categorical data.”
✅ one page per topic
✅ basic curriculum fulfilled (KS1 Year 1–2)
✅ fully illustrated
✅ thorough coverage
✅ concisely written
✅ Vocabulary Check
1️⃣ Get for 5 Beans
2️⃣ Download
3️⃣ Study!
